Now we will look at how to view the temperature of the processor (CPU), because the stability of the computer depends on this value. Many of us may have experienced that the computer suddenly reboots on its own, or the device experiences frequent freezes.
Although this happens due to various circumstances, very often the reason why the computer turns off on its own is due to overheating of the processor. Problems with high
CPU heating is quite common among PC gamers and users who run resource-intensive animation and video editing programs.
The Windows operating system also often causes hardware components to heat up, such as when you open too many browser tabs. Problems with CPU power consumption cannot be ignored because excessively increasing CPU temperature reduces the life of the CPU and can damage the motherboard as well as other PC hardware components over time.
When to check the temperature of the processor and video card
To effectively remove heat from the processor or video card to the cooling radiator, thermal paste and thermal pads are used.
The approximate service life of the “thermal interface” (that’s what they are called) is from 6 to 12 months, depending on how long it works. Accordingly, already after this period after the last “cleaning” you need to more closely monitor the processor temperature indicators.
Even better is to display their values on the desktop or taskbar using special programs.
Some useful information
If the internal temperature in a room increases by 1 degree, this causes the processor temperature to increase by 1.5 degrees. It can also be significantly influenced by the presence or absence of large free space inside the device case. Because of this, the processor temperature can vary from 5 to 10 degrees upward. The same changes can be observed when a personal computer is placed in a special table. Therefore, the placement of the PC must be treated with caution.
How to find out the CPU temperature in Windows 10 via Powershell
The easiest option is to use the Powershell terminal. To do this you need:
- In “Start”, find the “Windows Powershell” folder, run Powershell as an administrator (by calling the context menu).
- Enter the command get-wmiobject msacpi_thermalzonetemperature -namespace “root/wmi”. Press Enter.
- The current processor temperature is indicated in the "CurrentTemperature" section.
- And in order to convert it into understandable Celsius, you need to divide the indicated figure by 10 and subtract 273.15 (indicated in Kelvin by default).
If you see this message, it means this method does not work on your device. Continue below for other methods.
Check CPU temperature via command line
You can also find out the current temperature of the Windows 10 processor using the command line. To do this you need:
- Click “Search” on the taskbar. Enter "Command Prompt". Be sure to run as administrator.
- Enter the command: wmic /namespace:\rootwmi PATH MSAcpi_ThermalZoneTemperature get CurrentTemperature Press Enter.
- Several temperature values will appear (separately for each processor core, if such functionality is supported). To convert Kelvin temperature to Celsius, you need to divide the resulting number by 10 and subtract 273.15.
If the following message appears after pressing Enter, this means that this method is not supported on your PC
It should be taken into account that in the latest editions of Windows 10 this functionality has been removed. Instead, the developers recommend using the Powershell command interpreter (which in the future will completely replace the standard terminal).
HDD Thermometer
Read also: Benchmarks - what are they? Pros and cons of synthetic testing
Working window of the HDD Termometer program
With this program you can constantly monitor the temperature of all hard drives installed on your computer.
In its settings, you can easily set a critical limit, upon reaching which a sound alert will occur.
In addition, you can set certain actions to be performed by the program when the maximum temperature parameter is reached.
These include both starting sleep mode and completely turning off the computer for passive cooling.
When the utility is located in the system tray, you will have constant access to information about the current temperature of your hard drives.
For normal operation of the program, you will be required to register on the developers' website.
PROS:
- Fast,
- free
MINUSES:
- Requires registration on the developers website
Download
How to view the processor temperature in the "Task Manager"
Through the "Task Manager" you can find out the current temperature of the video card. But this is only relevant for modern CPUs (with support for WDDM 2.0, you need to check on the manufacturer’s website).
- To launch the dispatcher, press the combination Ctrl+Shift+Esc.
- Go to the "Performance" tab.
- The temperature will be listed in the GPU section.
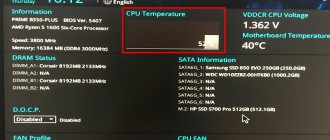
How to find out the processor temperature in Windows 10 in BIOS
You can also find out the current temperature of Windows 10 system components through the BIOS. But the function is not provided on all motherboards.
- To enter the BIOS, you must turn off the PC.
- Then press the power button and immediately press the “Del” key on the keyboard several times (when the manufacturer’s splash screen is displayed). It happens that you do not always need to press the DEL button to enter the BIOS. You can read which button is suitable for your PC here.
- Next, you need to find the “Health Status” section and find the line “CPU Temperature” in it.
More modern PCs have UEFI instead of BIOS. This is also a tool for configuring a hardware system, but with a more convenient graphical shell.
Special Applications
Previous methods of determining temperature (via BIOS, command line and PowerShell) do not always show a reliable picture of processor heating and do not work on all computers. In addition, the operating system's own tools provide only basic information about the temperature, and this is often not enough. Therefore, it is best to use specialized programs. Let's consider several of the most popular applications that allow you to obtain data on processor temperature and other indicators of computer performance in different operating systems.
HWMonitor for Windows
This program is distributed free of charge, and in order to determine the temperature, you just need to download the installation file and install the application. In addition, it is possible to use a portable version of HWMonitor, which you don’t even have to install. You just need to unpack the archive and run the program.
The first window will display the information we need. Here you can see the temperature of not only the processor, but also the video card, hard drives and motherboard. The information is systematized by device - to find the processor temperature indicator, you need to go to the AMD or Intel tab (the choice depends on the device model) and open the Temperatures section.
The program shows the temperature for each of the cores, and here you can check not only the current indicator, but also the minimum and maximum that HWMonitor has recorded since its launch. This is a big plus, since such data allows you to better diagnose the operation of the system. It will be possible, for example, after stopping the operation of a resource-intensive application (a game or other program that requires a large amount of energy), to go to HWMonitor and see what maximum level the temperature reached.
Among the advantages of the application are the Russian-language interface, the ability to save data to a file and support for a large number of sensors. Disadvantages – lack of graphs and data output during the game or other resource-intensive software.
MSI Afterburner
The program is very popular as a tool for overclocking and testing video cards, but it is also great for checking temperature readings. The main window displays all data on system operation in the form of graphs. In addition, unlike HWMonitor, this application allows you to constantly monitor the temperature of the processor and video card during gameplay, which allows you to test your computer under gaming loads.
Summarizing the advantages of MSI Afterburner, we can highlight the presence of graphs that simplify monitoring, display of temperature indicators of the processor, video card and RAM, support for overclocking video cards, various parameters for their operation and the ability to display data during games. The only downside of the program is that the interface is not very user-friendly.
HWinfo64
This professional-grade software provides comprehensive data about your computer's performance, including temperature, load, and voltage. Reports are generated here, which allows you to diagnose the state of the system. The application works with numerous sensors and reads the temperature of various sensor-equipped system components, such as the processor, video card, hard drives and motherboard.
Owners of AMD processors rate this program especially highly, since it shows both of their temperature parameters. However, in most other applications only one indicator is displayed. In addition, there are detailed information about the installed equipment.
Important: AMD processors, unlike Intel, have two temperature parameters: CPU Temperature and Core Temperature. The first indicator is obtained from a sensor located in the device chipset, and more precisely under light loads. And the core temperature is not the heating level of the matrix or processor case, but a figure obtained based on the maximum indicators - it is more accurate under significant loads. In the BIOS you can only see the CPU temperature, and in specialized programs there is mainly only the core temperature.
To view the data, you need to click the Sensors button on the main page of the program. For each indicator, a graph opens where you can analyze how the data changed over a certain period of time.
Thus, the main advantages of HWinfo64 are a variety of sensors and indicators, including temperature, load, frequency and voltage, detailed information about the computer, convenient graphics and excellent support for AMD processors. Disadvantages - the program is not Russified, it has a complicated interface, and information is not displayed during games. For the average user, understanding HWinfo64 metrics can be difficult. If you don't know what normal temperature should be, it's better to choose a simpler application that has data on minimum and maximum values, such as HWMonitor.
Core Temp
This popular utility is one of the simplest and allows you to analyze changes in the temperature of the processor and video card. You can find out the maximum and minimum data, as well as the percentage of processor load. The program shows the frequency and temperature of each core, as well as the overall indicator. There is an additional All CPU Meter application that works together with Core Temp, which shows the necessary data while working in other programs.
The main advantages are the simplicity of the interface and settings, data output to the system tray, Russification, the presence of a log for recording temperature information and pop-up notifications that the processor has overheated, as well as the ability to monitor the processor load and frequency. There are also disadvantages - you cannot view graphs, there is no option to view data during games.
Open Hardware Monitor
To find out the temperature or information about the equipment through this program, you do not have to install it. Just download and run. In the application you can find out the current temperature and load level on different elements of the system, as well as maximum indicators.
The main advantages of Open Hardware Monitor are the ability to display data in the gadget and tray, the simplicity of the interface and demonstration of indicators of various components of the system. Disadvantages - the program is not suitable for AMD processors and is not translated into Russian.
MonO System Monitor
The software has an interesting interface: it looks like a widget. Here you can evaluate how loaded the processor, hard drive and memory are, determine which application loads the computer the most and what problem needs to be solved to improve system performance. The processor temperature is displayed for each core.
The program attracts users with its appearance and the presence of the Russian language. Disadvantages – download links on the application’s website may not work, and it also tries to install third-party programs.
Speccy
The application is distributed in two versions - paid and free. It is possible to view information about the system and temperature indicators of its various components. Speccy is a program that is not particularly remarkable. The only peculiarity is that for Ryzen processors the temperature is displayed incorrectly.
The main advantages are the presence of graphs, additional information about the system, temperature indicators of various elements and a Russian-language version of the program. Disadvantages: the program does not work correctly with some processor models and pop-up offers to install the CCleaner application from the same developer.
CPU Thermometer
The most easy-to-use program with a minimalist design, specifically designed to determine the processor temperature and its load. In it you can only get these indicators separately for cores. In the settings you can change the units of measurement from Fahrenheit to Celsius and vice versa. There is also an option to show data in the system tray.
The main good thing about the program is that it is very easy to use and does not require installation. But there are also disadvantages: the inability to use with new models of AMD processors, the lack of additional options, graphics and a Russian-language interface.
RealTemp
This is a special application designed for Intel processors. If you have an AMD processor, it will not only not work, but will not even install. The current load and temperature are displayed here, as well as the minimum and maximum values.
The program has such advantages as simplicity, notifications when the temperature threshold is exceeded, and no installation required. Cons: no graphics and no Russian language.
SpeedFan
The application was developed to help regulate the speed of motherboard and processor coolers. The temperature is also measured here, since the cooler speed depends on it. In addition, you can view graphs and monitor voltage.
Among the advantages of SpeedFan, it is worth noting the ability to overclock, view graphs and control cooler speed. But the software does not have a Russian-language interface and does not support some modern processor models.
CAM
The program has a modern, aesthetic interface. It provides information about temperature, frequency and processor load, as well as general information about RAM, video card performance and the amount of free disk space. An additional feature is overclocking the video card.
Among the advantages of the application are Russification, an excellent interface, the presence of notifications when the maximum temperature limit is exceeded, synchronization with an account, the ability to overclock RAM, monitor the load and frequency of RAM, video card and processor, and view temperature change graphs. The program has one drawback, but it’s quite serious - you can’t estimate the temperature during the game.
Fanny for Mac
The Fanny application allows you to control the temperature on Mac OS computers. When using it, an icon appears in the top menu bar with data about the processor temperature and the speed at which the fan rotates. In addition, you can place a special widget in the Notification Center.
To use Fanny, you need to download the archive with it, unpack it and run the program through Finder. To do this, drag the Fanny.app installation file to the “Applications” tab in the sidebar. After this, the program will become available along with the others, and to launch it, you need to expand the applications tab. At the top of the menu there will be a Fanny icon - by clicking on it, you can call up a panel with the necessary information.
To add a program widget to the Notification Center, extract the sidebar, click on the create a new widget icon and add Fanny. Now the temperature and number of fan revolutions per minute will be displayed.
You will probably be interested in our other materials: about:
- how to find out your motherboard;
- how to check a video card for functionality;
- What programs are there to speed up your computer?
Check the Windows 10 processor temperature through the program
There are many third-party applications for diagnosing PC or laptop hardware. And with their help you can also find out the current temperature. And not only for the processor and video card. Some of them can read information from northbridge sensors, hard drives, and even RAM memory chips.
How to find out the processor temperature “GPU Z”
A free mini-utility that allows you to determine the temperature of your video card. One of its main advantages: it also supports GPUs integrated into the processor and takes up less than 5 megabytes on the hard drive. After launching it, you need to go to the “Sensors” tab. The current temperature is indicated in the “GPU Temperature” line.
Find out the processor temperature using “AIDA64”
The program is paid, but there is a 30-day trial period. Its advantages are its support for a very wide range of sensors. You can find out the temperature readings of the hard drive, motherboard, cooler rotation speed, and so on.
- After launching the application, you need to open the “Computer” tab in the left column and select “Sensors”.
- The processor temperature is indicated in the “CPU” item.
HWInfo
The free HWInfo utility, designed to obtain information about the characteristics of the computer and the state of hardware components, is also a convenient tool for viewing information from temperature sensors.
In order to see this information, simply click the “Sensors” button in the main program window; the necessary information about the processor temperature will be presented in the CPU section. There you will also find information about the temperature of the video chip if necessary.
You can download HWInfo32 and HWInfo64 from the official website https://www.hwinfo.com/ (the HWInfo32 version also works on 64-bit systems).
How to find out the processor temperature “Video instructions”
View the processor temperature using the “Speed fan” program
This application is designed to control the rotation speed of the installed processor cooler. But you can also find out the temperature with its help. And most importantly, it is free. You just need to launch the application. The current temperature value is indicated in the “Temp1” line.
If for some reason nothing is displayed there or an impossible temperature is indicated (for example, -20 degrees), then you need to select “Configure” and indicate the model of the motherboard or laptop.
Find out the processor temperature using “Piriform speccy”
Another free mini-utility. But now it is updated quite rarely, so on modern motherboards it does not always correctly determine the current temperature. The best option for old PCs and laptops.
- After launch, you need to select “Central Processor”.
How to see PC temperature on Windows 10 in “Core temp”
Free mini program. Its advantage: it normally determines the temperature of the hardware if there are several processors installed on the motherboard (server board). And it also shows the current heating separately for each core.
Core Temp
Core Temp is a simple free program in Russian for obtaining information about processor temperature, works in all latest versions of the OS, including Windows 7 and Windows 10.
The program separately displays the temperatures of all processor cores, and this information is also displayed by default on the Windows taskbar (you can set the program to startup so that this information is always in the taskbar).
Additionally, Core Temp displays basic information about your CPU and can be used as a CPU temperature provider for the popular All CPU Meter desktop gadget (mentioned later in the article).
There is also its own desktop gadget, Windows 7 Core Temp Gadget. Another useful addition to the program, available on the official website, is Core Temp Grapher, for displaying graphs of CPU load and temperature.
You can download Core Temp from the official website https://www.alcpu.com/CoreTemp/ (additions to the program are also located in the Add Ons section).
CPU temperature standards
But the processor heating rate for each CPU is individual. Information can be found on the official website of the developer (Intel, AMD). “Critical value” must be indicated in technical specifications.
But for older processors it is not always possible to find this information. Therefore, you can focus on the following values:
- Normal processor temperature: up to 50 degrees without load, up to 85 degrees with active use.
- Normal video card temperature: up to 45 degrees without load, up to 90 degrees with active use.
And to conduct a “stress test” you can use either AIDA 64 (“Service” – “System Stability Test”) or Furmark.