Gadgets are small applications that provide the user with various useful information. They are often used in Windows 7, informing about the weather, broadcasting news feeds and displaying the current state of the computer. It is one of these gadgets that will be discussed further.
Processor temperature is an important indicator. Despite the fact that modern CPUs have protection against overheating, this factor is often the cause of slow computer operation and sudden shutdowns.
What is a gadget for Windows
A gadget for Windows is a special mini-application that is as easy to use as possible and designed to perform simple, highly specialized tasks.
The gadget platform debuted about 10 years ago in the Windows Vista operating system and was then part of another mechanism - the Sidebar. Initially, the system offered only a small group of simple gadgets, including a clock, calendar, weather viewing, news feeds and exchange rates, as well as monitoring the processor and RAM. The user could install the rest of the gadgets from the official catalog website or from third-party sources.
For example, the first two gadgets in the screenshot above are not included in the initial kit and were installed separately by the author of the article.
Since Windows 7, Microsoft has allowed gadgets to take on a life of their own by allowing the user to place them anywhere on the desktop. In turn, it was decided to abandon the sidebar, although in the system memory all gadgets for Windows remained united by the common process sidebar.exe.
The disappearance of gadgets occurred shortly before the release of the final version of Windows 8. Literally at the very last stage of its testing, Microsoft cut out mini-applications from the system. The formal reason was security problems suddenly discovered in gadgets, however, what prevented the corporation from fixing them and returning this functionality to the system is a mystery.
Utilities and programs for viewing the temperature of a computer or laptop processor
This category of software includes both specialized utilities for assessing the state of a computer, which characterize all its components, and desktop widgets.
When choosing a program, you should pay attention not only to the list of supported processors, but also to the bit depth of their architecture. Applications with an identical database designed for 32-bit processors will run on 64-bit systems, but not vice versa.
CPU Thermometer
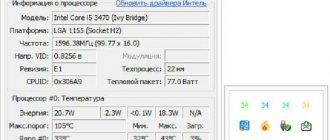
This program is distributed free of charge and is suitable for cases where, in addition to temperature indicators and processor type, no additional information is required. It is a functional and resource-saving option for the system. After startup, the processor temperature values will be displayed in the Temperatures section.
Easy to install and use, the CPU Thermometer app also shows the CPUID instruction, frequency and processor core number. If the temperature exceeds the user-set values, the utility can both display alarm messages and turn off or reboot the device, depending on the settings.
AIDA64
This application is one of the most popular and powerful utilities that provides detailed information about the operation of the computer, its elements, the OS and any component of the device block. AIDA64 allows you to identify potential problems in the functioning of the system and conduct tests for its stability. The program is distributed for a fee with a 30-day trial period that does not require financial costs
To view the processor temperature, go to the “Computer” section of the menu column on the left and select “Sensor”. Its values are displayed in both degrees Celsius and Fahrenheit.
CPUID HWMonitor
This software does not contain such a detailed description of system parameters and its status as AIDA64, but it is distributed free of charge. In addition, this program is easier to use. As in most cases, the most reliable option is to download from the developer's website.
In the program window, the temperature of the processor and each of its cores is indicated separately next to the name of the CPU. Temperature values are distributed in three columns in the order of current, minimum and maximum since the time the utility was launched. Additionally, HWMonitor displays:
- core load;
- current voltage of system unit components;
- cooler operating intensity;
- temperature indicators of hard drives, motherboard and video card.
Speccy
Inexperienced PC or laptop users are often recommended to use the Speccy program to display information about computer components. It is distributed free of charge and is available in 24 languages, with both standard and portable installation methods. At the same time, the utility also has an extended paid version. Providing information about the system, Speccy, guided by sensors on the motherboard, also displays temperature indicators of individual components in the general information section.
Speedfan
This program is designed to control the speed and volume of the cooler and regulate the voltage of cooling systems. It runs on all versions of Windows, supporting a wide range of motherboards, SCSI drives and access to SMART information
The interface of this utility may seem complicated for a beginner, but it is completely free. In addition to the state of the processor and its cores individually, it displays the temperature of the video card and hard drives. Speedfan can create scales of temperature changes, allowing you to monitor the level of heating of the processor and other components during loads of varying degrees.
HW iNFO
This free utility includes a set of options to identify and diagnose system components that support the latest computer industry products and standards. These tools are suitable for assessing the general condition of a device and updating drivers, as well as for assembling components, developing cross-system applications and technical expertise. Provided in a simple and accessible form, the information can be stored in various types of reports.
To view CPU temperature indicators, just click the Sensors item in the main application window. This section also contains information about the video adapter, starting with its name, for example, Nvidia. In order to work with HWiNFO, you will need:
- download and install the program;
- make the necessary settings (if errors are displayed after startup);
- select the Settings item in the Program item;
- check the following lines: Minimize Main Windows on Startup, Shared Memory Support, Show Sensors on Startup and Minimize Sensors on Startup;
- click OK.
Clipboarder gadget for Windows 10
Clicking on an element instantly adds it to memory, individual elements can be pinned, and mouse dragging is supported. The gadget has a wide selection of design themes; in addition, like any mini-application, Clipboarder supports transparency adjustment. In the settings you can specify the maximum length of the feed (maximum 100 elements), feed style, hot keys, etc.
Unit converter
Confused about units of information, energy or area, but do you often need the associated calculations for work/study? In this case, pay attention to Unit Conventer - the best gadget designed for converting various quantities. In addition to those mentioned, Unit Conventer also works with temperature, mass, length, time, pressure and a number of other parameters.
Multi Meter
A very simple gadget that will allow you not to disturb the task manager once again. The load on the processor cores is displayed here, as well as the amount of memory used, both as a percentage and in specific numbers:
In the settings you can set the update interval, as well as the appearance of the gadget:
CPU load and temperature
Another CPU and RAM load indicator from the fruit series, this time
Fruit indicator of CPU and computer memory usage, made in the style
An excellent gadget that shows in real time the CPU load level (including
A simple indicator of computer processor load, which has
Original processor (CPU) and memory (RAM) load indicator, made in
Cute gadget-indicator of central processing unit (CPU) load, design
A simple and concise gadget for Windows 7 that shows the load level
Gadget CPU load indicator, with extensive appearance settings.
Another compact gadget that shows the loading level of the central
A nice indicator of the CPU and RAM load level.
A simple gadget that shows the CPU load level in
The gadget displays CPU usage and shows five processes that are running
A wonderful gadget that controls the loading level of the central
A nice modification of the standard processor load indicator and
A very simple and concise application that shows the total load
Compact and very convenient indicator of processor and RAM load.
The gadget shows several of the busiest processes at the moment.
A nice modification of the standard CPU and RAM load indicator.
RAM and CPU load indicator, made in
A juicy processor and RAM load indicator, designed in the form
A nice and convenient indicator of RAM and processor load.
IntelCoreSerie is a very convenient gadget for viewing the number of cores
Source
HUD Time
Numerous gadgets in the form of clocks and calendars, as a rule, are not very useful, since the same information is displayed next to the system tray. However, there is one exception: if you are far from the screen, you may not be able to make out what is written in the lower right corner. If you have exactly this scenario, then pay attention to HUD Time - a huge clock, displaying the month and day of the week. They can be placed anywhere on the desktop, and the transparency level, font and text color can be adjusted.
Launch Control
Not everyone likes to clutter up their desktop and taskbar with a large number of shortcuts, which then involuntarily begin to get confused. Perhaps this is why someone might find the small Launch Control gadget useful, in which links to various applications, applets and actions with the system are arranged in groups:
Such a miniature gadget, at first glance, has quite a lot of settings. In the main section you can add, delete and edit groups with shortcuts:
And in addition you can customize the appearance in detail:
Other gadgets for Windows 10
Alas, since the gadget platform was long ago thrown out of Windows and abandoned by Microsoft, many third-party developments also ceased their development. As a result, a number of good mini-applications from the times of Vista and Windows 7 have turned out to be inoperative today.
As part of 8GadgetPack, in addition to several very trivial gadgets like all kinds of calendars, clocks and notes, there are also a number of interesting finds that are kept up to date by the authors of this kit. We see no point in describing them in detail, but we’ll still say a few words.
In particular, we note Remove Drive Safely Glassy, which allows you to quickly and safely remove flash drives, as well as CPU Network Monitor and Glassy Network Monitor, which will clearly show you the CPU and network load without accessing the task manager.
In turn, MiniRadio will allow you to listen to some Western radio stations, Recycle Bin will make it possible to manage the recycle bin without going to it, Top Five will display the five processes that load the system the most, and Volume Control will help you adjust the volume without specifically clicking on a tiny icon on the taskbar.
This is the list of the best gadgets for Windows 10 that we have decided to share today. Did you find something interesting for yourself?
See also: Chess, minesweeper and solitaire for Windows 10: returning games to the new OS
Igor Andreev is the author of articles for ITRew.ru and Our-Firefox.ru. I am passionate about modern technologies, I talk about them in my texts)
Author's page – twitter.com
Good afternoon friends. The topic of our article is “CPU and video card temperature windows 10 widget.” I have already mentioned many times that it is advisable for the user to know what the temperature of the processor and video card of his computer is. The easiest way to observe these processes is if we install a widget on the desktop that will show these parameters.
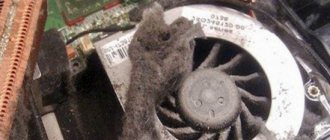
To a greater extent, this applies to computers that can no longer be called young. The hardware of which is poorly compatible with modern programs. Such an Analysis is needed if the CPU or GPU heats up due to dust clogged in the cooler screws and radiator strips. Also, as I have said many times, heating occurs due to dried thermal paste, which has lost its function to retain heat. Even more, the thermal paste may not just dry out, but be erased due to the constant rotation of the cooler. Then the heat will be released in full!
If the user cannot understand why the processor and video card began to heat up, in this case, you need to install a widget that will show the temperature of these elements of Windows 10. The creators of this OS have removed the program that previously showed these values. All we have to do is return them using the following applications, which will be discussed in this article.
GPU Meter - Video card temperature gadget for windows 7, Windows 10 and Windows 8.1
GPU Meter is the best Windows desktop gadget to display your graphics card temperature in real time! Thanks to it, you can monitor the temperature of your video card at any time. In addition, the gadget shows the manufacturer and name of the video card, its clock frequency, total and used video memory, and fan speed. If you need a video card temperature gadget, then GPU Meter is the best solution to this issue.
Setting up the GPU Meter video card temperature display gadget
1.Download and install the GPU Meter gadget;
2.Download and run the PC Meter program as administrator;
3. Call up the PC Meter program window;
4. Check that all the boxes are checked in the settings;
With these settings, the program will launch itself along with Windows and you will not have to launch it manually each time in order to display the temperature of the processor and video card.
5.Go to the gadget settings;
6.On the “Options” tab, in the “Select Method” line, select “ON(PC Meter)”;
7.Apply the settings by clicking on the Ok button;
Tell us about us on social networks. Help our site!
All CPU Meter
This widget is part of the 8GadgetPack installation utility, which helps us return familiar floating windows from Windows 10. But, not all windows are similar, but related to the CPU. In more detail, we will find out its temperature, frequency, and type of crystal.
- So, download the required program installer from the link...;
- Install this utility;
- On the left of the screen we have a clock and weather widget. But, we need a widget that shows the temperature. Therefore, we will click on the widget with the right mouse button. We have a drop-down menu where we select “Add gadget”;
- A new window is opening for us. In it we are interested in the “All CPU Meter” widget. Click on it and select “Add”.
- It appeared right under the weather clock. If desired, we can simply move the widget to another location on the monitor by simply clicking on it with the mouse and moving it to the desired part of the screen (it happens that two widgets appear, in which case one can be deleted).
- If this widget seems small to you, you can easily enlarge it by clicking on the key image on the right. That is, we will go into the settings of this widget;
- So, by entering the “Settings” of this software, we can turn off functions that are not of interest to us, or increase the size of the widget, adding, for example, 200%. Don't forget to click OK. Our widget has doubled in size;
- In my opinion, he looks much nicer.
In the “Options” menu we can change the values to the ones we need.
- First of all, look at which widget you have chosen. If “ON All CPU Meter”, select it on the top line. If "ON PC Meter", then it is better to select it;
- For example, we can change the temperature from Celsius to Fahrenheit;
- Change the frequency of information changes “Refresh rate (sec)”;
- You can set a sound alarm if the temperature reaches a critical level, etc.
In the “Color” menu we can change any color to the desired one using various parameters. You will notice that at the very bottom of the widget there is a curve graph with different colors. These are the temperature colors of all the active cores in your processor.
Temperature gadgets
Unfortunately, Windows 7 only includes a CPU load indicator among the system monitoring gadgets, and there is no similar tool for monitoring processor temperature. Initially, it could be installed by downloading from the official Microsoft website. But later, since this company considered gadgets to be a source of system vulnerabilities, it was decided to completely abandon them. Now tools that perform the temperature control function for Windows 7 can only be downloaded from third-party sites. Next, we will talk in more detail about the various applications in this category.
All CPU Meter
Let's start the description of gadgets for monitoring processor temperature with one of the most popular applications in this area - All CPU Meter.
- By going to the official website, download not only the All CPU Meter itself, but also the PC Meter utility. If you do not install it, the gadget will only show the load on the processor, but will not be able to display its temperature.
Then run the unpacked file with the gadget extension.
A window will open in which you need to confirm your actions by clicking “Install”.
The gadget will be installed, and its interface will immediately open. But you will only see information about the load on the CPU and on individual cores, as well as the percentage of RAM and page file load. Temperature data will not be displayed.
Return to the directory where you unpacked the contents of the PCMeter.zip archive. Go inside the extracted folder and click on the file with the EXE extension, the name of which contains the word “PCMeter”.
The utility will be installed in the background and will appear in the tray.
Now right-click on the “Desktop” plane. Select “Gadgets” from the options presented.
The gadgets window will open. Click on the name "All CPU Meter".
The interface of the selected gadget opens. But we won’t see the processor temperature displayed yet. Hover over the All CPU Meter shell. Control icons will appear to the right of it. Click the Settings icon, which is shaped like a key.
The settings window opens. Go to the "Options" tab.
A set of settings will be displayed. In the “Show CPU temperatures” field, select “ON (PC Meter)” from the drop-down list. In the “Temperature Show In” field, which is located just below, you can select the temperature unit from the drop-down list: degrees Celsius (default) or Fahrenheit. After all the necessary settings have been made, click “OK”.
- Now, opposite the number of each core in the gadget interface, its current temperature will be displayed.
CoreTemp
The next CPU temperature detection gadget we'll look at is called CoreTemp.
- In order for the specified gadget to correctly display the temperature, you must first install a program, also called CoreTemp.
After installing the program, unzip the pre-downloaded archive, and then run the extracted file with the gadget extension.
Click “Install” in the installation confirmation window that opens.
AIDA64 is an excellent CPU analyzer
An excellent program, at one time it was considered one of the best. You can download it from the link... from the official website. Now on the official website there are most trial versions, there is a demo for 30 days. I downloaded this one. Unpack the program and run it. We launch the program (if you are not satisfied with the trial versions, you can download AIDA from the torrent site for a later version).
- To start AIDA, run the file aida64.exe;
- The program begins to read information. So, you need to open the “File” tab and select “Settings”;
- Go to the “Hardware Monitoring” tab, select “SensorPanel”;
- ABOUT;
- Next, we need to select the background color of the window and other color settings. Click “Apply”, then OK;
- Next, we need to right-click on the panel and select “Sensor Panel Manager”;
- Then, you need to click on the required parameter. A window will open where we can change the settings we need. For example, change the color, file name, size, etc.
- If you want to change the touchpad, you can do this using the Export command;
- If you decide to launch AIDA along with the OS, then you need to go into the settings and activate the program’s autorun functions while the OS is loading;
Monitor GP is a widget that will be installed if you already have the 8GadgetPack program installed. Therefore, before downloading it, you must be sure that this program is already installed. So, it is downloaded from the link https://7gadget.net/engine/download.php?id=726
- This link may not work, but it doesn’t really matter to us, since this program is in the list of 8GadgetPack programs, so we simply select it from this list, right-click on it and click “Add” in the context menu;
- This gadget will automatically appear on your screen;
- This widget is “Russian-language”, unlike many others. This is its main advantage. So the first thing we need to do is turn on our language. To do this, click on the wrench to go to the “Settings” of the program, and select language images in the top menu. Then, above the “language” line, select “Russian language” from the drop-down menu. Now we can easily do all the program settings in our native language;
- Then, go to “Settings” and then we need to select the video card. If the utility does not detect it, then you need to update the drivers and restart the computer;
- In the first menu, you can increase the size by the amount you need by placing the percentage you need above the “Size” command;
- In the fourth menu, check the box if you want a sound signal to warn about overheating of the central processor;
- In the fourth menu, in addition, do not forget to check the box “Display core temperature”;
- By going to the ninth menu, you need to adjust the color palette if you don’t like the palette proposed by the designer;
- In menu A you can record the analysis in a text element;
- Don't forget to save your settings. The only thing I didn’t like about this program was that I have a large monitor, and I still didn’t understand how to enlarge this widget.
Using Core Temp
This software is distributed free of charge. Its purpose is to measure processor temperature. Information about the state of its cores is displayed on the taskbar. The program's functions include displaying other data about the operation of the CPU and RAM, which makes the utility useful for constantly monitoring system performance. All these values are displayed only while the software is running.
To use CoreTemp, you need to download and install the application from the official website. The Russified version is taken from other trusted resources. The developers' page contains a list of supported processors, which includes products from AMD, Intel, and x86 processors from VIA.
Other widgets of the 8GadgetPack program
This list of programs contains quite a lot more widgets. Including the processor. For example, the “CPU Indicator” widget has few functions, but it displays the most important thing, the core temperature. I advise you to look at other widgets. There are many useful programs there.
For example, this list has an excellent widget for displaying data about a video card “CPU Meter”. I recommend.
Also, I want to remind you that too many desktop widgets increase the temperature of the same processor and video card!
Conclusion: I have provided only three widgets that perfectly show the temperature of the processor and video card. In my opinion, the most functional and beautiful Monitor GP widget, that is, the third. If you don’t really like them, there are still quite a lot of different widgets on the Internet that are ready to perform this information. Good luck!
Sincerely, Andrey Zimin 12/27/2019
Important Tips
I once used an old computer, which over time stopped coping with the tasks assigned to it. Accordingly, the load on the CPU and graphics adapter increased, which led to an increase in the temperature of the chips. If you miss a critical moment, you can cause irreparable harm to the microcircuits. That is why I recommend using a gadget that displays the degree of heating of processors.
This is especially true for gamers who play modern 3D games. They definitely need to monitor system indicators so as not to “ruin” the equipment. Very often, users use the ability to “overclock” the frequency through BIOS settings or other software. In this case, the probability of exceeding the permissible temperature limit increases significantly. You can't do without a special widget. It is capable of not only displaying the real picture, but also alerting with sound signals when danger occurs.
Before moving on to looking at useful utilities, I’ll tell you briefly about ways to reduce temperatures.
- At a minimum, you should perform a comprehensive PC cleaning. The system unit is easy to clean. It is enough to remove the lid and carefully vacuum the “insides”. You can additionally use a soft brush to access hard-to-reach places. With a laptop, things are different. It is better to entrust its disassembly to professionals.
- The second thing to do is replace the thermal paste that is applied to the contact surfaces of the processor and motherboard. It is better to entrust this work to specialists.
- If the above measures do not give a positive result, then you should replace the cooling system (cooler, radiator) of the process processor and video card.
All CPU Meter
The widget is part of the 8GadgetPack program, designed to return Windows 10 to the functionality of floating information windows familiar to users. It displays information related to CPU load only. In addition to temperature, these are: the load on each of the involved cores, the amount of RAM used, the current frequency and crystal model.
1. Download the application installer from https://8gadgetpack.net/.
2. Install and run the program. You can read more about installation in the instructions (How to install gadgets).
3. To display the informer, right-click on the widget panel that appears on the right side of the desktop and call the “Add...” command.
4. Using the context menu of the “All CPU Meter” element, call the command to display it on the panel.
5. Move the window to a convenient place on the desktop by clicking on the name of the processor in it. Clicking on other areas will not allow you to change the position of the element. You can also download the PC Meter app from https://addgadgets.com/pc_meter, extract and run it.
The All CPU Meter program works in a similar way. https://addgadgets.com/all_cpu_meter/
6. Go to settings using the open-end wrench icon to the right of the window.
7. Make the necessary changes in the “Display” tab - here you can turn off the visualization of uninteresting information and increase the size of the gadget.
8. In the “Options” tab, in the “Show CPU temperatures” line, select the value “ON PC Meter” or “ON All CPU Meter” depending on the selected application.
9. Provide other information if necessary:
- temperature units;
- information update frequency “Refresh rate (sec)”;
- warning when a critical value is reached, including audio;
- limit temperature, etc.
In the “Color” tab, you set the colors in which certain parameters will be colored.
All CPU Meter - CPU temperature gadget for windows 7, Windows 10 and Windows 8.1
Introducing the best desktop gadget that displays tons of useful real-time information about your CPU, including its temperature! All Cpu Meter also shows the name of the processor, its logo, the frequency at which it operates, the name of the computer, the total and free amount of RAM, the load on each processor core and their temperature. The performance of this CPU temperature gadget has been tested on windows 7, windows 8.1 and windows 10. PCMeter is required for the gadget to work correctly.
Setting up the All Cpu Meter processor temperature display gadget
1.Download and install the All Cpu Meter gadget;
2.Download and run the PC Meter program as administrator;
3. Call up the PC Meter program window;
4. Check that all the boxes are checked in the settings;
With these settings, the program will launch itself along with Windows and you will not have to launch it manually each time in order to display the temperature of the processor and video card.
5.Go to the gadget settings;
6.On the “Options” tab, in the “Show CPU temperatures” line, select “ON(PC Meter)”;
7.Apply the settings by clicking on the Ok button;
HWiNFO32
1. Download the appropriate version of the information utility from the link. https://www.hwinfo.com/download/.
To install the HWiNFOMonitor gadget on your desktop, you must install the 8GadgetPack program.
2. Download the official gadget from the program developer’s page. https://www.hwinfo.com/add-ons/.
3. Launch and install them.
As a result, an empty gadget will appear. It must be configured via HWiNFO32.
4. Launch the program and go to its configuration parameters through the “Settings” menu item.
5. Check the boxes next to the first three settings items and “Shared Memory Support”.
6. Open the “Sensors” window via the toolbar.
Afterwards, a huge list of information from the sensors will appear in the gadget window. The line contains the CPU temperature.
To prevent the information from disappearing, minimize the “Sensor Status” window. HWiNFO must work and transmit information to the gadget, otherwise its window will be empty.
Let's sum it up
In this article, we got acquainted with widgets for monitoring the temperature indicators of the central processor and video card on the Desktop. From the examples discussed, it is clear that any PC user can launch and configure widgets. You can study additional material to learn how to install other widgets on the Windows 10 desktop by following the link.
We hope that this material will be useful to you and will allow you to easily monitor the system using the widgets discussed.
AIDA64
1. Download the trial version of AIDA64 Extreme (portable version is possible) and run the utility. https://www.aida64.com/downloads.
2. After reading information from all sensors, open the first item of the main menu and go to settings.
3. Expand the “Temperature Monitoring” list and click on the “SensorPanel” link.
4. Oh.
5. Select the background color of the window, its transparency and size, and save the configuration.
6. Right-click on the panel and select “Gauge Panel Manager”.
7. Remove unnecessary indicators and change their sequence.
Double clicking on any of the parameters will open a window for changing it. Here you can specify a number of its variables: color, name, value, size, position, font, etc.
The touchpad view can be saved to a separate file using the Export command.
To automatically start the gadget, go to the settings and activate the options to autostart the utility when Windows 10 starts and launch the window in minimized form.
AIDA64 is the only program that allows you to monitor the temperature of not only the CPU (central processing unit), but also the core of the graphics card. It also contains the largest number of information panel settings.
GPU Monitor
The GPU monitor is a gadget that is installed through 8GadgetPack. Download it and install it if you have this program. https://7gadget.net/engine/download.php?id=726. The widget will automatically appear on your desktop. Also useful: “weather, CPU and GPU temperature widgets, and desktop clock.”
1. Go to settings and select your video card.
2. In the second tab, indicate its unit of measurement, the need for a sound warning after reaching the critical temperature and its value.
3. In the 4th tab, remove unnecessary graphs, numbers and stripes.
4. In the 5th - specify the colors for displaying data if the standard ones are not suitable. In the 6th, the function of recording readings to a text file is available.
5. Save settings and use.
There are many ways to solve the problem: third-party gadgets and applications. Moreover, they all have a large list of parameters available to the user to change, and opportunities for customization.
Source