During operation of the operating system, like any other software, errors periodically occur. It is very important to be able to analyze and correct such problems so that they do not appear again in the future. In Windows 10, a special “Error Log” was introduced for this purpose. This is what we will talk about in this article.
Windows 10 error log - how to view the report
Users may experience hardware and software glitches when using Windows 10. So that personal computer owners can find out what caused the problems, the developers created a special Windows 10 error log. It records the history of errors and failures, as well as the source of their occurrence. You can access the log using standard OS tools: command line or control panel. Thus, many users ask how to view logs in Windows 10?
Windows 10 Event Log - what is it and what is it for?
The event log is a diagnostic and troubleshooting tool for the OS. When errors occur, a special log file is created where a report about the problematic software or OS system component is recorded.
By analyzing the event collector, you can find out the reasons for the incorrect operation of the OS. For high-quality diagnostics of a personal computer, several logs are provided: “Applications”, “Installation”, “Security” and “OS Settings”. Each of them logs the failure code, date and time, and damaged files that cause the error.
What reports can be viewed in the system event collector:
- Report on the installation of applications, drivers and utilities.
- The state of the software and hardware components of a personal computer.
- Errors in the operation of system services and background OS processes.
- Invalid Registry Editor keys or corrupted binaries.
- Change settings for your network connection or wireless access point.
- Register a user to sign in to a Microsoft account or account.
- Logs a user out of a local or Microsoft account.
- Disable Windows Firewall or Built-in Defender.
- Reports on damaged system components of critical files.
- Installing updates and security patches.
- Indexing files and folders.
- Registration about enabling and disabling services and background processes.
- Register your computer's connection to a WiFi or WAN Miniport wireless network.
- Registration of system crashes in BSOD (blue screen of death).
Important! The error log is a log file where information about failures in the OS is recorded, which will help the owner of a personal computer find and fix the problem.
How to open the log, see errors and where it is located
To find the log where error reports are stored, you need to do the following:
- You need to go to the desktop and find a shortcut called “Computer.
- After this, “Explorer” will open, where you should select the local disk partition.
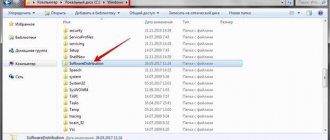
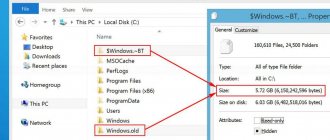
- The user needs to select the system volume and find the “Windows” directory.
- In this folder you should find a directory named “System32”.
- Then you need to scroll down the list and find the “Winevt” folder.
- The “Log” directory will contain reports that have the “EVTX” extension.
In order for the owner of a personal computer to be able to check the reports, it is necessary to use the special standard utility “eventvwr”. Only with the help of this utility can you view reports and find out why problems occurred.
For your information! Files with the "EVTX" extension cannot be opened using the built-in text editor.
Using filters and custom views
The sheer number of events in the logs makes them difficult to navigate. In addition, most of them do not contain critical information. The best way to display only the events you need is to use custom views: you can specify the level of events you want to display—errors, warnings, fatal errors—and their source or log.
To create a custom view, click the appropriate item in the panel on the right. After creating a custom view, you can apply additional filters to it by clicking on “Filter current custom view”.
Of course, this is not all that Windows Event Viewer can be useful for, but this, as noted, is an article for novice users, that is, for those who do not know about this utility at all. Perhaps it will encourage further study of this and other OS administration tools.
Sources used:
- https://lumpics.ru/error-log-in-windows-10/
- https://public-pc.com/kak-posmotret-zhurnal-oshibok-v-windows-10/
- https://winerror.ru/windows-10/kak-posmotret-zhurnal-oshibok-v-windows-10-2990
How to check the system for integrity and errors
The operating system of a modern computer is a complex architecture consisting of a large number of programs, scripts, services, drivers, instructions and databases. The more complex the tool, the greater the chance of something breaking. Damage to an important system file can lead to crashes, poor performance, or complete computer failure and loss of personal or system files.
Using the console
You can open the event collector log using the system debugging console - PowerShell:
- You need to go to the start window and enter the executable code “PowerShell” in the search bar.
- After that, in the dialog box, select “Run with extended access rights.”
- After loading the debug console, you should enter the executable command called “eventvwr”.
- The event collector console will then be displayed on the screen.
The collector is opened using PowerShell
Via control panel
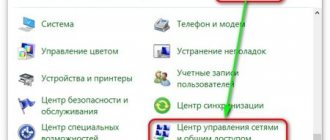
You can view logs in Windows 10 through the classic Control Panel and you can do this as follows:
- You need to enter the start menu and enter the query “Control Panel” in the search bar.
- Next, open the “Security” item and scroll down the list.
- Then you need to go to “Administration”.
- In the list of standard tools, find the “Events” component.
- Next, the “Event Log” window will open, where you should select “View events”.
- A list of several items will appear in the left column: “Programs”, “Installation” and “OS Settings”, “Redirected logs”. To view the report, you need to click on one of the components and select “Details” in the main window.
Where and what is in the event viewer
The interface of this administration tool can be divided into three parts:
- The left panel contains a tree structure in which events are sorted by various parameters. In addition, you can add your own “Custom Views” here, which will display only the events you need.
- In the center, when you select one of the “folders”, the list of events itself will be displayed on the left, and when you select any of them, in the lower part you will see more detailed information about it.
- The right side contains links to actions that allow you to filter events by parameters, find the ones you need, create custom views, save the list, and create a task in the task scheduler that will be associated with a specific event.
How to view Windows 10 update logs?
View Windows update history in Windows 10
- Open PowerShell: one way is to write PowerShell in the search bar and select it from the results found. Ad.
- Type Get-WindowsUpdateLog and press Enter. ...
- You now have a Windows update log file on your desktop.
Enabling logging
In order for the system to record all events in the log, it must be enabled. To do this, follow these steps:
- Right-click anywhere on the taskbar. From the context menu, select "Task Manager".
- In the window that opens, go to the “Services” tab, and then on the page itself at the very bottom, click the “Open Services” button.
- Next in the list of services you need to find “Windows Event Log”. Make sure it is running and running in automatic mode. This should be indicated by the inscriptions in the “Status” and “Launch Type” columns.
- If the meaning of the specified lines is different from what you see in the screenshot above, open the service editor window. To do this, double-click with the left mouse button on its name. Then switch the “Startup Type” to “Automatic” mode, and activate the service itself by clicking the “Run” button. Click "OK" to confirm.
After this, it remains to check whether the paging file is activated on the computer. The fact is that when it is turned off, the system simply will not be able to keep track of all events. Therefore, it is very important to set the virtual memory value to at least 200 MB. Windows 10 itself reminds you of this in the message that appears when the paging file is completely deactivated.
We have already written about how to use virtual memory and change its size in a separate article. Please review it if necessary.
Launching Event Viewer
As we mentioned earlier, the Error Log is included in the standard Event Viewer snap-in. It's very easy to launch. This is done as follows:
- Press the Windows key and R on your keyboard at the same time.
- In the line of the window that opens, enter eventvwr.msc and press “Enter” or the “OK” button below.
As a result, the main window of the mentioned utility will appear on the screen. Note that there are other methods that allow you to launch Event Viewer. We talked about them in detail earlier in a separate article.
Error log analysis
Once Event Viewer is launched, you will see the following window on your screen.
On the left side there is a tree system with sections. We are interested in the “Windows Logs” tab. Click on its name once with LMB. As a result, you will see a list of nested subsections and general statistics in the central part of the window.
For further analysis, you need to go to the “System” subsection. It contains a large list of events that previously occurred on the computer. There are four types of events: critical, error, warning, and information. We will briefly tell you about each of them. Please note that we cannot physically describe all possible errors. There are many of them and they all depend on various factors. Therefore, if you cannot solve something on your own, you can describe the problem in the comments.
Critical Event
This event is marked in the journal with a red circle with a cross inside and a corresponding postscript. By clicking on the name of such an error from the list, a little lower you can see general information about the incident.
Often the information provided is enough to find a solution to the problem. In this example, the system reports that the computer was abruptly turned off. To prevent the error from appearing again, simply turn off the PC correctly.
Read more: Shut down Windows 10 system
For a more advanced user, there is a special “Details” tab, where the entire event is presented with error codes and listed sequentially.
Error
This type of event is the second most important. Each error is marked in the log with a red circle with an exclamation point. As in the case of a critical event, just click LMB on the name of the error to view the details.
If you don't understand anything from the message in the "General" field, you can try to find information about the error online. To do this, use the source name and event code. They are indicated in the corresponding columns opposite the name of the error itself. To solve the problem in our case, you simply need to reinstall the update with the required number.
Warning
Messages of this type occur in situations where the problem is not serious. In most cases, they can be ignored, but if the event repeats itself over and over again, it is worth paying attention to it.
Most often, the reason for the warning is the DNS server, or rather, an unsuccessful attempt by some program to connect to it. In such situations, the software or utility simply turns to the backup address.
Intelligence
This type of event is the most harmless and was created only so that you can be aware of everything that is happening. As its name implies, the message contains summary information about all installed updates and programs, created restore points, etc.
Such information will be very useful for those users who do not want to install third-party software to view the latest Windows 10 activities.
As you can see, the process of activation, launch and analysis of the error log is very simple and does not require you to have deep PC knowledge. Remember that in this way you can find out information not only about the system, but also about its other components. To do this, just select another section in the Event Viewer utility.
Event Information
As I said above, when you select an event, information about it will be displayed at the bottom. This information can help you find a solution to the problem on the Internet (however, not always) and it is worth understanding which property means what:
- Log name - the name of the log file where the event information was saved.
- Source - the name of the program, process or system component that generated the event (if you see Application Error here), then you can see the name of the application itself in the field above.
- Code - the code of the event, can help you find information about it on the Internet. True, it’s worth searching in the English-language segment for Event ID + digital designation of the code + name of the application that caused the failure (since the event codes for each program are unique).
- Operation code - as a rule, “Details” is always indicated here, so this field is of little use.
- Task category, keywords - usually not used.
- User and computer - reports on behalf of which user and on which computer the process that caused the event was launched.
At the bottom, in the "Details" field, you can also see an "Online Help" link, which reports information about the event to the Microsoft site and should, in theory, display information about this event. However, in most cases you will see a message saying that the page was not found.
To find information about an error, it is better to use the following query: Application name + Event ID + Code + Source. You can see an example in the screenshot. You can also try searching in Russian, but there are more informative results in English. Text information about the error is also suitable for searching (double-click on the event).
Note: on some sites you can find an offer to download programs to correct errors with one or another code, and all possible error codes are collected on one site - you should not download such files, they will not fix problems, and will most likely lead to additional ones.
It's also worth noting that most warnings aren't anything dangerous, and error messages don't always mean there's something wrong with your computer.
I answer popular questions
What to do if the viewer is disabled? How to enable it?
- First, you need to log into the OS under an account with administrator rights. Then open the services section via the keys (Win + S).
- Find the “Event Log” module in the list and right-click to open “Properties”.
- Set the startup type to automatic, click “Apply” and then “Run”.
Is it possible to disable the Event Viewer service?
Yes, you can stop the logger. This will not affect the operation of the OS in any way. But you will lose an excellent tool for diagnosing and auditing computer problems.
What is the easiest way to view a schedule of computer startups and shutdowns? So as not to search in a general list of thousands of lines.
Get the free utility “TurnedOnTimesView”. Link to the official website of the developer "NirSoft".
You should also go into the configuration and enable the “Load Log” option. Press Win + R on the keyboard - msconfig - Enter.
Move to “Download”. Place a checkmark next to the desired item. Save the settings by clicking “Apply” and “OK”. After this, logging will begin.
It loads the disk, the processor (all cores are loaded) and eats up RAM. How to fix it?
Sometimes, the Event Log Host service places a significant load on the components, making it difficult to use your computer. Most often this is due to Windows 10 crashes and can be fixed as follows.
- Go to the command line.
- Type chkdsk C: /f and click Enter.
- Next is dism /online /cleanup-image /restorehealth.
- Next sfc /scannow.
- Restart the Event Log service.
Additionally, try disabling updates.
Run window
You need to launch the Run window. How to do it? For example, you can hover your mouse over the “Start” button, right-click and select “Run” from the menu.
There is another way - press Win + R on the keyboard.
When the window is launched, specify the command eventvwr.msc , and then click on the OK button.
The event log has been started.
Warning
These alerts appear when the danger to the computer is not great. It is not necessary to pay attention to such messages all the time. But, if these alerts appear quite often, it is worth considering them. Warnings look like yellow triangles with a question mark inside.
The reasons for their occurrence are different. For example, one of my applications did not receive permission to activate. Most likely, it will try to activate in another way. If not, then this case needs to be considered in more detail.
Method 1: via bat file.
Create a text file and paste the code below into it. Then we rename the txt extension to bat, and everything is ready to run.
@echo off FOR /F "tokens=1,2*" %%V IN ('bcdedit') DO SET adminTest=%%V IF (%adminTest%)==(Access) goto theEnd for /F "tokens=* " %%G in ('wevtutil.exe el') DO (call :do_clear "%%G") goto theEnd :do_clear echo clearing %1 wevtutil.exe cl %1 goto :eof :theEnd
It is important to remember that you need to run the file as an administrator; to do this, right-click on the file and select “run as administrator.”
For those who are too lazy to create such a file, you can download it below.
Download